Business Cycle Developments has been producing market research since 1981 to institutional money managers with assets under management exceeding $2.5 trillion. Over the years the look and presentation of the research has changed but one thing has not – that is our disciplined approach and proprietary database. When faced with a contradiction to the general market consensus, BCD solely relies on its database and consequently has made some timely market calls. Below you can find just a few of our most recent equity reports.
Stock Market Peak Monitor Stock Market Trough Monitor
Below are reports with historical perspective that show the timeliness of BCD and also gives an insight into how the data works.
May 16, 2000 – “Sell” This targeted the monthly average S&P 500 peak between August ’00 thru April ’01 at a level between 1489 and 1712. It peaked in August 2000 at a monthly average of 1485! The S&P decline was -36%!
September 21, 2001 – “Buy” This timed the very bottom in the S&P related to the 911 attack! – subsequent gain +21% to March 2002.
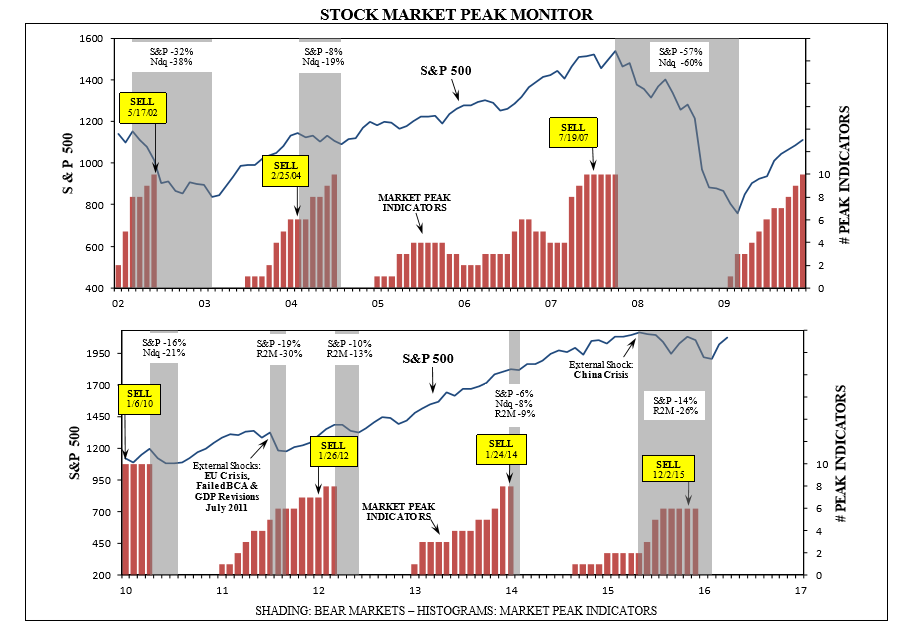
May 17, 2002 – “Sell” This “sell” missed the S&P peak by 3% and 20 trading days, but the ensuing decline was -34% to October 2002!
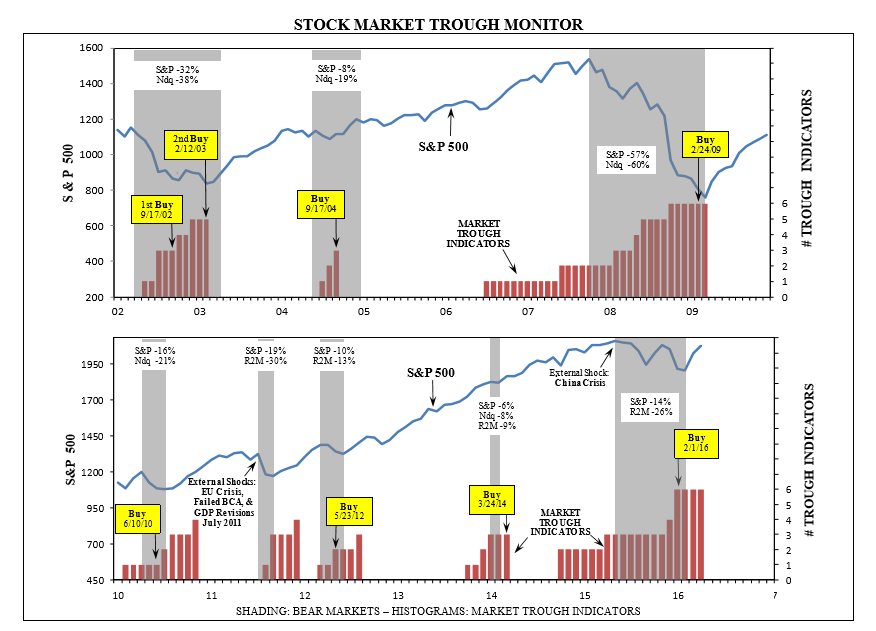
September 17, 2002 – “Buy” Sixteen days later the S&P bottomed on 10/2/02 and then climbed +49% to February 2004 peak!
February 12, 2003 – “Buy” SARS and the 2003 Iraq Invasion interrupted the October ’02 bull market. Eighteen days after this report the S&P bottomed slightly above the 10/2/02 low and climbed +45%!
February 25, 2004 – “Sell” This “sell” passed up the S&P peak by nine days and 1.6%. The following decline was two tiered, as the S&P fell -8% and the Nasdaq dropped -19%.
September 17, 2004 – “Buy” This “buy” missed the daily close low by 12 days, or 2%. The subsequent S&P peak was +39% higher 36 months later.
July 19, 2007 – “Sell” Expected the S&P to peak between July and November 2007 at a monthly average between 1534 and 1662 – the peak was in October 2007 at 1540. The decline was -57%!
February 24, 2009 – “Buy” This “buy on weakness” was nine days before 3/9/09 S&P low! The subsequent gain to the next peak was +80%!
January 6, 2010 – “Sell” This report identified the next S&P peak at 1219 in June 2010 – the actual peak was in April 2010 @ 1217! The ensuing decline was -16%.
June 10, 2010 – “Buy” Sixteen days after this BCD update predicted a bottom in the S&P, it’s low was on July 22, 2010 – the gain for the following 20 months was +39%!
August 26, 2011 – “Buy” Japan’s Tsunami, the Euro Crisis, a failed Budget Control Act and lower GDP revisions interrupted the July 2010 bull market. Twenty-five days after this “buy” report the S&P bottomed on 10/3/11 for a +29% gain!
January 26, 2012 – “Sell” Twenty-six days after this “sell on strength” report the S&P peaked and the subsequent decline was a mild -10%, due to the extension of Operation Twist & QE #3.
May 23, 2012 – “Buy” Seven days after this “buy on weakness” with a target level of 1266 the S&P bottomed on June 4, 2012 at 1278! The next peak was +45% higher 19 months later.
January 24, 2014 – “Sell” This “sell” report was dated six days after the January 15th peak and the ensuing decline in the S&P was only -6%, as the Fed equivocated on the December 18th tapering in late January and the S&P bottomed on February 3, 2014.
March 24, 2014 – “Buy” This “buy” missed the S&P low by 34 days and 6% primarily due to the data lag attributed to the Fed reversal on tapering. The S&P gain from 3/24/14 to the next peak was +15%.
May 28, 2015 – There wasn’t evidence for an S&P peak six days after the May 21st Chinese devaluation (an external shock), which triggered a -14% drop in the S&P for eight months. The Russell 2000 declined -26%! As expected, yields peaked and U.S. output fell -3.8%.
February 1, 2016 – “Buy” Eight days after this “buy” the S&P troughed, finally discounting the Chinese devaluation and the U.S. slowdown. The subsequent S&P climb was +57%!