Business Cycle Developments has been producing macro economic and market research since 1981 to a list of U.S. and international creme de la creme institutional money managers – including a U.S. Treasury Secretary – with assets under management exceeding three trillion dollars. Over the years the look and presentation of the research has changed but one thing has not – that is our disciplined approach and proprietary database. When faced with a contradiction to the general market consensus, BCD solely relies on its database and consequently has made some timely market calls. Below you can find just a few of our bond market equity reports since 2000.
Interest Rate Peak Monitor
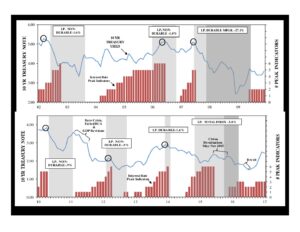
Interest Rate Trough Monitor
Below are reports with historical perspective that show the timeliness of BCD and also gives an insight into how the data works.
August 31, 2001 “sell bonds”: This August 2001 report points to yields bottoming in November 2001 and the monthly average for T-Note yields reached a low in October 2001. Ensuing T-Note yields climbed 122 basis points to 5.44% in April 2002.
June 26, 2003 “sell bonds”: T-Note yields bottomed the very month this report stated: “…pointing to a cyclical low in the 10 year T-Note yields immediately ahead.” The subsequent climb in yields was 212 basis points for three years until June 2006.
May 15, 2006 “buy bonds”: Thirty-one days after this report was written “…a bond rally appears just ahead” yields peaked at 5.25% on June 28, 2006 and fell 75 basis points to March 2007.
March 15, 2007 “sell bonds”: Two days after yields bottomed on March 13, 2007 expectations switched based on the number of Interest Rate Trough Indicators and yields were expected to bottom in March 2007, which proved correct. The ensuing climb in yields was 76 basis points.
July 18, 2008 “sell bonds”: In July 2008 there were 5 of 7 Interest Rate Trough Indicators signaling and these IRTI’s pointed to a bottom in November 2008. This proved correct, as T-Note yields dropped 318 basis points to December 18, 2008.
March 25, 2010 “buy bonds”: There were only two of six Interest Rate Peak Indicators signaling in March 2010, but there were sufficient Business Cycle Peak Indicators pointing to a peak in output as early as July 2010. Because yields peak with output, we anticipated a peak in yields – they peaked in April 5, 2010 and fell 168 basis points.
November 29, 2010 “sell bonds”: This November 29, 2010 report of “sell bonds” came 33 days after the bottom in the 10 year T-Note yield on October 8, 2010 – yields had already risen 43 bps. from 10/8/10. T-Note yields continued to climb 134 basis points and peaked coincident with the Fukushima Shock of March 11, 2011.
March 28, 2012 “sell bonds”: Eighty days after this report to ‘sell bonds on strength’ the T-Note yield bottomed with Draghi’s “whatever it takes” statement. Following the July 2102 low T-Note yields climbed 161 basis points to December 2013!
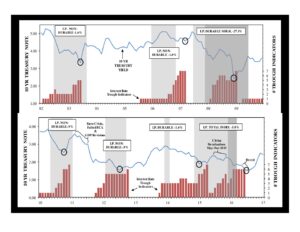
April 5, 2013 “Fed to tighten in the 4th quarter of 2013”: When Draghi eased in July 2012 and QE #3 started in September 2012 this report predicted that the Fed would reverse policy and tighten in the 4th quarter of 2013. Right on schedule, Bernanke started “tapering” in December 2013 and T-Note yields peaked that December at 3.04%!
August 15, 2014 “sell bonds”: This August 2014 report predicted yields would bottom in November 2014 (September 2014 thru January 2015) and right on schedule, yields bottomed in January 2015!
May 19, 2015 “buy bonds”: Sixteen days after this report was published T-Note yields peaked on June 10, 2015 at 2.5% and fell 113 basis points to 1.37% on July 8, 2016.
June 16, 2016 “sell bonds”: This June 16, 2017 update reaffirmed the low in T-Note yields once Britain leaves the EU, which they did on June 23, 2016 – six days later.
October 10, 2018 buy bonds”: In this October 2018 BCD update all six of six Interest Rate Peak Indicators pointed to a monthly average T-Note peak of 3.11% – it peaked at 3.15% in October 2018.
July 9, 2019 “sell bonds”: “There are six of seven Interest Rate Trough Indicators signaling a bottom in 10 year T-Note yields in June 2019 extending thru September.” Monthly average yields were 2.06% in July 2019 and they fell to a monthly average 1.64% in August 2019 and bottomed in the targeted area and subsequently climbed into the Covid-shock peak in yields.
March 3, 2021 “buy bonds”: “Currently, there are four of six Interest Rate Peak Indicators signaling.At the 4thIRPI the average lead time to a peak in T-Note yields is four months (+/- 4 mo.), which centers a peak in April 2021…. “Bonds look attractive on any weakness.”Monthly average T-Notes were 1.61% in March 2021 and peaked at 1.64 in April 2021 – one month later.
April 26, 2023 “sell bonds”: There’s also five of seven Interest Rate Trough Indicators signaling. The most recent IRTI signaled in January, so that centers a trough in May 2023 (Apr. thru Aug.)…. Today’s monthly average (17 trading days in April) T-Note yield is 3.47%.” T-Note yields bottomed at a monthly average 3.46% – the very month this BCD report was published.
July 22, 2024 “The prevailing view is that the Fed’s going to lower interest rates and yields will respond. The IRTI’s confirm that we’ve likely seen the cyclical low for this cyclical slowing! So, the low in yields was earlier this year.” As expected T-Note yields moved higher when the Fed cut in September 2024!